
Advanced Returns Analytics
Transform Data Into Strategic Insights
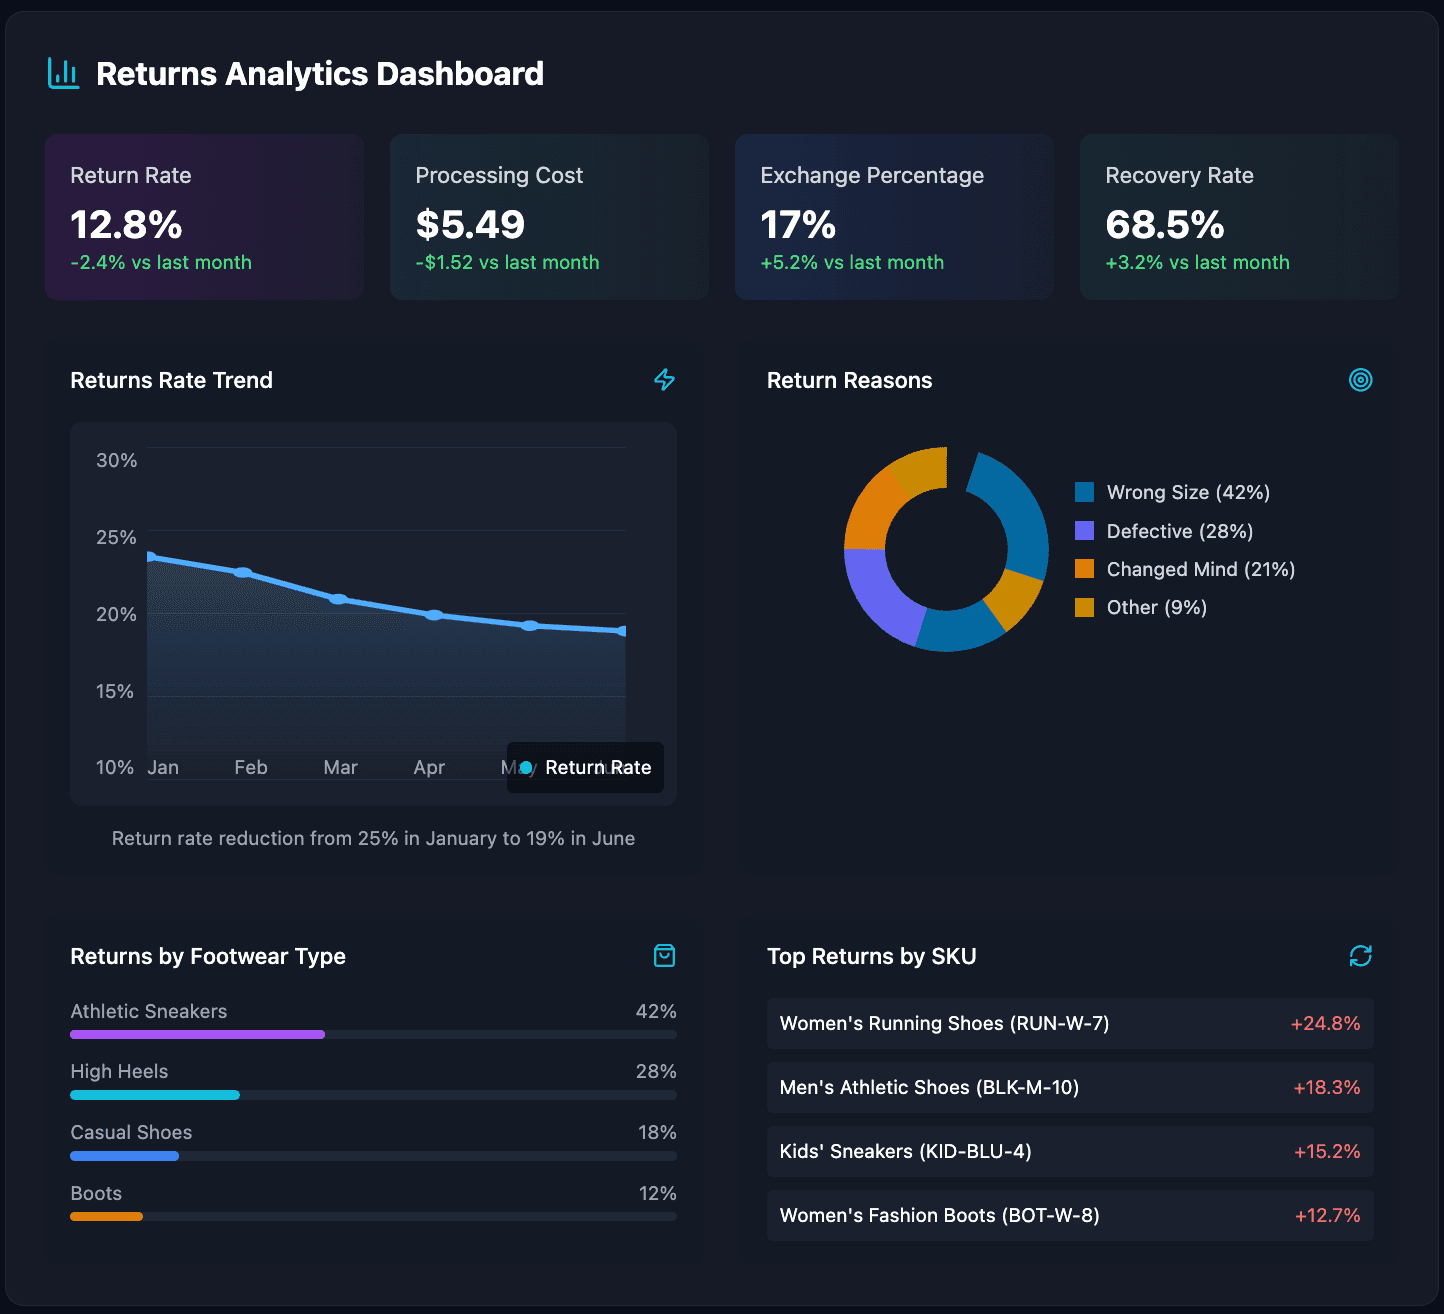
Our comprehensive returns analytics platform provides deep insights into your returns data, helping you understand why items are being returned, identify product issues, and make data-driven decisions to improve your business.
Returns Analytics Dashboard
Key Features
- ✓Comprehensive Dashboard
Real-time visualization of key metrics and trends
- ✓Product Performance Insights
Identify high-return products and understand why they're being returned
- ✓Predictive Analytics
Forecast return volumes and identify potential issues before they escalate
- ✓Custom Reporting
Build and schedule tailored reports for different stakeholders
Business Benefits
- ↓Reduce Return Rates
Identify and address the root causes of returns
- ↑Improve Product Quality
Use return data to enhance product design and descriptions
- ↑Optimize Recovery Value
Make data-driven decisions about return disposition
- ↑Strategic Decision-Making
Base inventory, merchandising, and operational decisions on solid data
Customer Feedback Analytics Dashboard
Customer Feedback Analysis - Return Process
Insights from customer feedback on return experience:
Data based on sentiment analysis of 1,280 customer feedback entries this month.
Detailed Breakdown of Return Process Issues
Drill-down into specific customer complaints for targeted improvements.
Sub-categories for: Delayed Refunds
Sub-categories for: Return Label Generation Issues
Sub-categories for: Policy Not Clear
Based on analysis of 550 detailed feedback tickets related to process issues.
Return Process Issues: EU Regional Analysis
Comparison of 'Delayed Refund' reports across key European markets.
Data represents percentage of customers reporting 'Delayed Refunds' in Q2.
Analytics in Action
Identify Patterns
Our analytics engine automatically detects unusual return patterns and product issues.
Visualize Impact
Interactive dashboards show the financial and operational impact of returns across your business.
Recommend Actions
AI-powered recommendations suggest specific actions to reduce returns and improve recovery.
Track Results
Monitor the effectiveness of your interventions with before-and-after analytics.